Dashboard Widget List
This is part of the Visual Dashboard Reporting Add-on Module.
Below is a full list of widgets available as part of the Visual Dashboard Reporting Add-on Module with a brief description of each. Remember that the data shown is calculated based on the date ranges you enter.
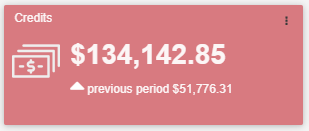
Credits
Credit total on posted orders only.
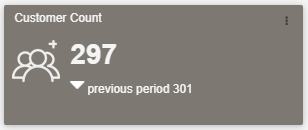
Customer Count
Number of customers with posted sales orders (invoices).
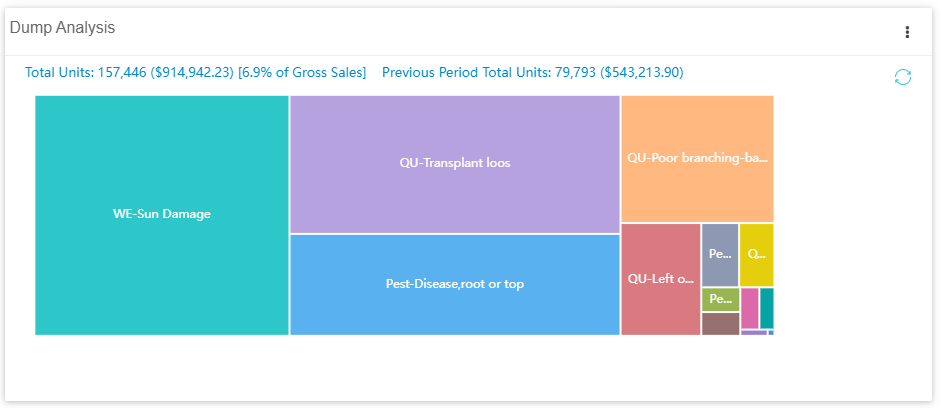
Dump Analysis
Breakdown by dump reason. Setting options: Select a pricing group for valuation, select a quantity range to include, exclude some sizes from the breakdown.
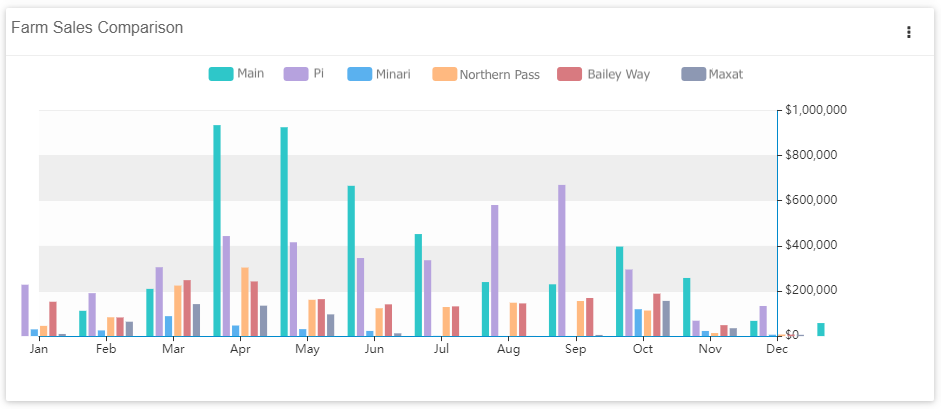
Farm Sales Comparison
Comparison of monthly sales by farm based on posted orders only. Setting options: Select which farms to include.
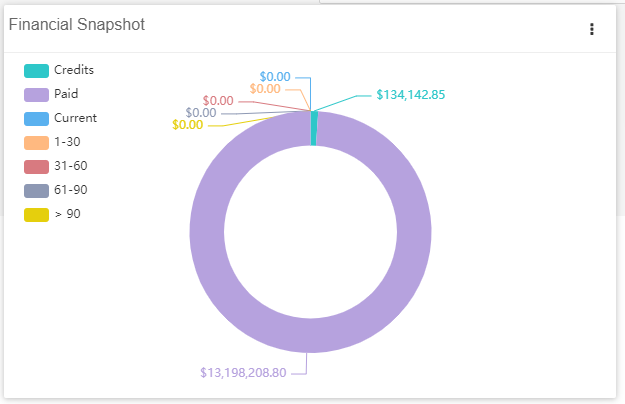
Financial Snapshot
Quick view of accounting data
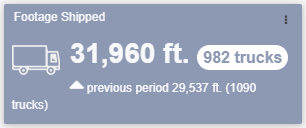
Footage Shipped
Total footage on completed loads
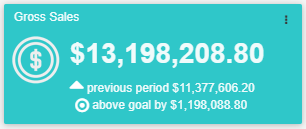
Gross Sales
Gross sales calculated from "Total Due" amount on posted invoices.
 )
)
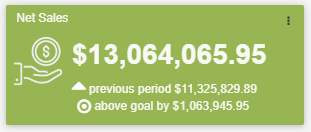
Net Sales
Net sales calculated from "Total Due" amount on posted sales orders and credit memos.
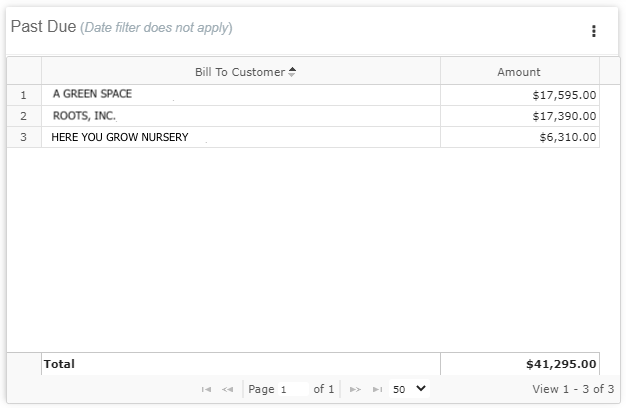
Past Due
Amount owed by customer. Setting options: Choose to show only invoices transferred to QuickBooks.
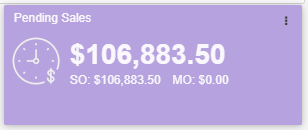
Pending Sales
Pending sales calculated from “Total Due” amount on open master and sales orders.
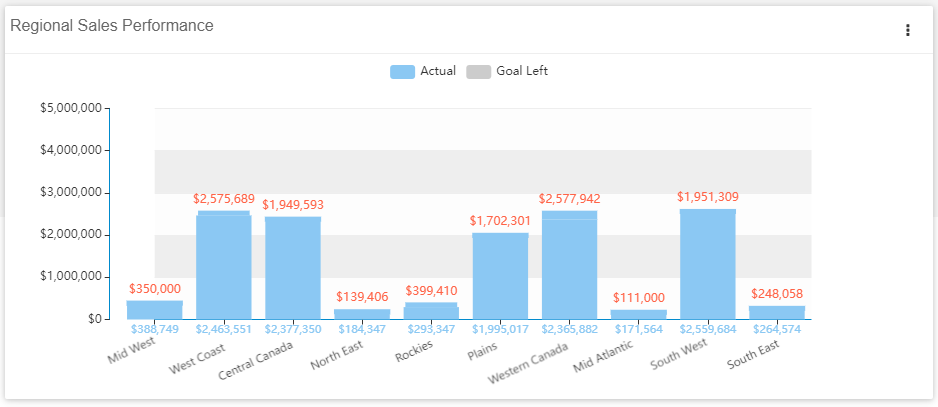
Regional Sales Performance
Net sales from posted sales orders and credit memos by region, compared to the goal set for the calendar year.
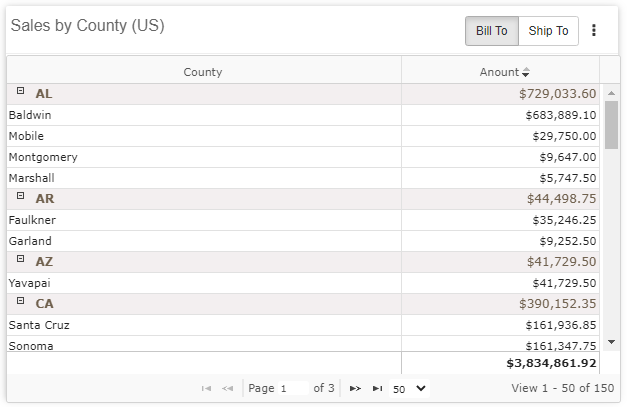
Sales by County (US)
Net sales from posted sales orders and credit memos by county, for US only. Setting options: Toggle between using the “Bill To” or “Ship To” addresses.
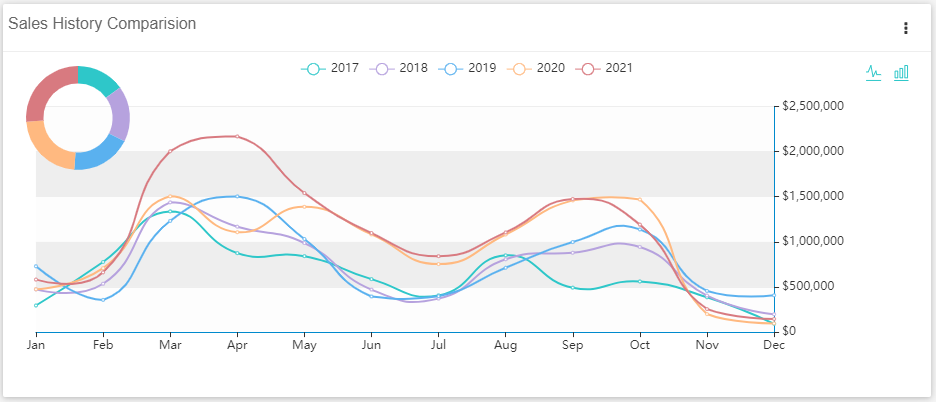
Sales History Comparison
Comparison of net sales history by year. Setting options: Toggle between line or bar graph.
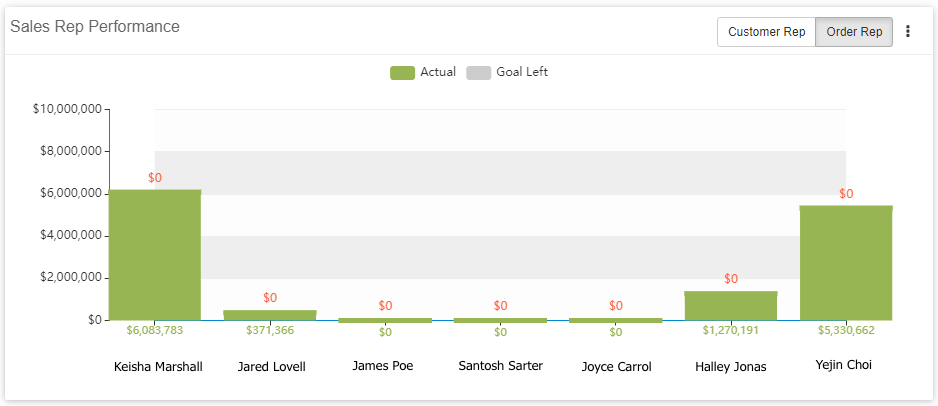
Sales Rep Performance
Net sales comparison by sales representative, compared to goal set for calendar year. Settings options: Toggle between Customer Rep and Order Rep.
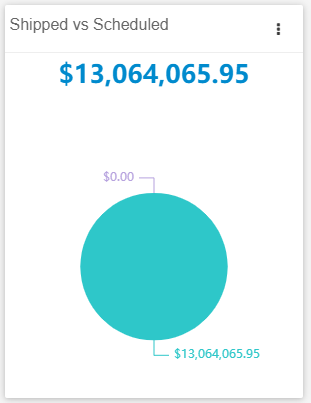
Shipped vs Scheduled
Shipped is “Total Due” amount from posted sales orders and credit memos and Scheduled is “Total Due” from sales orders on not-completed loads.
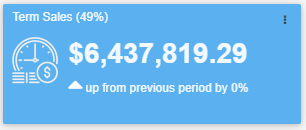
Term Sales
Total gross sales by Terms type. Setting options: Select with Terms type to show, can change the name of the widget.
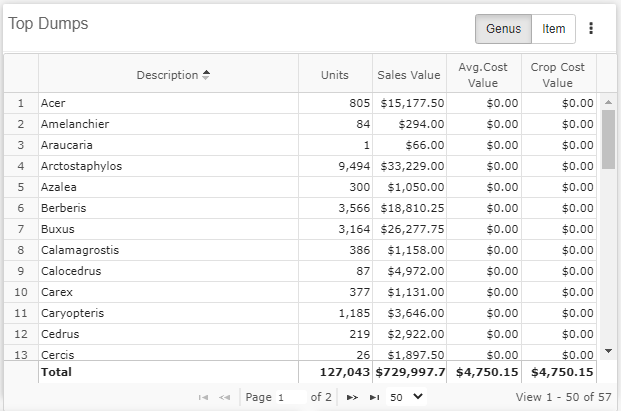
Top Dumps
List of top dumps, defaulted to show top 10. Setting options: Toggle between Genus or Item, Select a pricing group for valuation, select a quantity range, choose how many dumps to appear on the list, select if value or quantity determine highest spot, exclude sizes from the calculations.
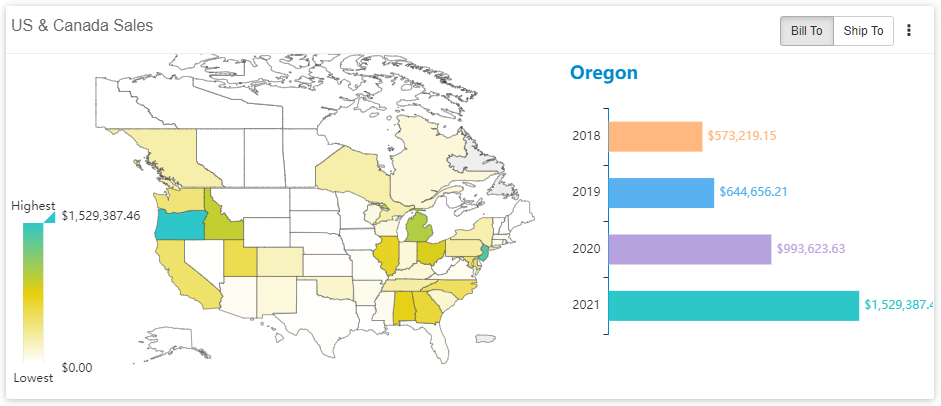
US & Canada Sales
Heat map of sales in the US and Canada based on net sales. Setting Options: Toggle between “Bill To” and “Ship To” addresses.